This is not a SQL database. It does not have a relational data model, it does not support SQL queries, and it has no support for indexes.
Only a single process (possibly multi-threaded) can access a particular database at a time.
There is no client-server support builtin to the library. An application that needs such support will have to wrap their own server around the library.
Contributing to the leveldb Project
The leveldb project welcomes contributions. leveldb's primary goal is to be a reliable and fast key/value store. Changes that are in line with the features/limitations outlined above, and meet the requirements below, will be considered.
Contribution requirements:
POSIX only. We generally will only accept changes that are both compiled, and tested on a POSIX platform - usually Linux. Very small changes will sometimes be accepted, but consider that more of an exception than the rule.
Stable API. We strive very hard to maintain a stable API. Changes that require changes for projects using leveldbmight be rejected without sufficient benefit to the project.
Tests: All changes must be accompanied by a new (or changed) test, or a sufficient explanation as to why a new (or changed) test is not required.
Submitting a Pull Request
Before any pull request will be accepted the author must first sign a Contributor License Agreement (CLA) athttps://cla.developers.google.com/.
In order to keep the commit timeline linear squash your changes down to a single commit and rebase on google/leveldb/master. This keeps the commit timeline linear and more easily sync'ed with the internal repository at Google. More information at GitHub's About Git rebase page.
Performance
Here is a performance report (with explanations) from the run of the included db_bench program. The results are somewhat noisy, but should be enough to get a ballpark performance estimate.
Setup
We use a database with a million entries. Each entry has a 16 byte key, and a 100 byte value. Values used by the benchmark compress to about half their original size.
LevelDB:    version 1.1
Date:       Sun May  1 12:11:26 2011
CPU:        4 x Intel(R) Core(TM)2 Quad CPU    Q6600  @ 2.40GHz
CPUCache:   4096 KB
Keys:       16 bytes each
Values:     100 bytes each (50 bytes after compression)
Entries:    1000000
Raw Size:   110.6 MB (estimated)
File Size:  62.9 MB (estimated)
Write performance
The "fill" benchmarks create a brand new database, in either sequential, or random order. The "fillsync" benchmark flushes data from the operating system to the disk after every operation; the other write operations leave the data sitting in the operating system buffer cache for a while. The "overwrite" benchmark does random writes that update existing keys in the database.
Each "op" above corresponds to a write of a single key/value pair. I.e., a random write benchmark goes at approximately 400,000 writes per second.
Each "fillsync" operation costs much less (0.3 millisecond) than a disk seek (typically 10 milliseconds). We suspect that this is because the hard disk itself is buffering the update in its memory and responding before the data has been written to the platter. This may or may not be safe based on whether or not the hard disk has enough power to save its memory in the event of a power failure.
Read performance
We list the performance of reading sequentially in both the forward and reverse direction, and also the performance of a random lookup. Note that the database created by the benchmark is quite small. Therefore the report characterizes the performance of leveldb when the working set fits in memory. The cost of reading a piece of data that is not present in the operating system buffer cache will be dominated by the one or two disk seeks needed to fetch the data from disk. Write performance will be mostly unaffected by whether or not the working set fits in memory.
LevelDB compacts its underlying storage data in the background to improve read performance. The results listed above were done immediately after a lot of random writes. The results after compactions (which are usually triggered automatically) are better.
Some of the high cost of reads comes from repeated decompression of blocks read from disk. If we supply enough cache to the leveldb so it can hold the uncompressed blocks in memory, the read performance improves again:
readrandom   :       9.775 micros/op;  (approximately 100,000 reads per second before compaction)
readrandom   :       5.215 micros/op;  (approximately 190,000 reads per second after compaction)
Repository contents
See doc/index.html for more explanation. See doc/impl.html for a brief overview of the implementation.
The public interface is in include/*.h. Callers should not include or rely on the details of any other header files in this package. Those internal APIs may be changed without warning.
Guide to header files:
include/db.h: Main interface to the DB: Start here
include/options.h: Control over the behavior of an entire database, and also control over the behavior of individual reads and writes.
include/comparator.h: Abstraction for user-specified comparison function. If you want just bytewise comparison of keys, you can use the default comparator, but clients can write their own comparator implementations if they want custom ordering (e.g. to handle different character encodings, etc.)
include/iterator.h: Interface for iterating over data. You ca n get an iterator from a DB object.
include/write_batch.h: Interface for atomically applying multiple updates to a database.
include/slice.h: A simple module for maintaining a pointer and a length into some other byte array.
include/status.h: Status is returned from many of the public interfaces and is used to report success and various kinds of errors.
include/env.h: Abstraction of the OS environment. A posix implementation of this interface is in util/env_posix.cc
include/table.h, include/table_builder.h: Lower-level modules that most clients probably won't use directly.
Let's you connect your laptop to the iPhone to surf the web.
At least when you don't want to jailbreak your iPhone so far you've had only one option if you want to connect from your laptop via iPhone to the internet. And that's paying an additional fee to your mobile carrier to provide you with the signed tethering profile.
iProxy does not give you tethering - it just gives you the next best thing. A http and a socks proxy on your iPhone. Similar to the famous netshare app did before it got pulled from the App Store.
iProxy is not as convenient as the real tethering. The internet connection is a few clicks more away. But if you've got a developer certificate (or have a friend that has one) it certainly is cheaper than handing out the money to your favorite telco. Especially if you only need this connection every now and then.
iProxy is just an evening hack of a project so it's far from perfect. But iProxy is released under the Apache license and freely available on github. So fork away if you want to see something fixed.
This is to give back to the community ...and to stop the ripoff madness.
Feel free to give some feedback via twitter.
Torsten
@tcurdt
Please check the following links for getting iProxy configured.
http://github.com/tcurdt/iProxy/wikihttp://github.com/tcurdt/iProxy/wiki/Configuring-iProxyhttp://www.memention.com/blog/2010/05/15/Removing-a-step.html
Ganglia Web 2 (gweb2) is a refresh of the Ganglia PHP UI. We plan to continue adding new features, and bringing the Ganglia web code up to date after some years of inattention. This page details some of the main new features which will be available in an upcoming release.
Requirements
It is recommended that you install the PHP JSON extension. It isn't *required*, but it provides better performance than the Net_JSON PEAR extension. The extension is included in PHP 5.2 and later; if you are on 5.1 use `pecl` to install e.g.
pecl install json
`pecl` is part of `php-pear` package on RHEL/CentOS. Make sure you add extension.json to your PHP extensions ie.
  # cat /etc/php.d/json.ini
  extension=json.so
On RHEL/CentOS 4, you will also need `phpize` which comes with the `php-devel` package.
You will also need PHP XML support which is part of e.g. `php-xml` or `php5-xml` package. Without it export of graphs in CSV and JSON format will not work.
Installation
Latest release of Ganglia Web 2 can be downloaded fromhttps://sourceforge.net/projects/ganglia/files/gweb/. Download the gweb tarball and unarchive it somewhere in your web tree then rename the resulting directory to a URL you want e.g. `/var/www/ganglia2` (Ubuntu/Debian) or `/var/www/html/ganglia2` (Centos/RHEL) e.g.
  tar xvf gweb-1.9.9.2607M.tar.gz
  mv gweb-1.9.9.2607M ganglia2
You can run Ganglia Web 2 in parallel to your existing Ganglia UI if you so desire. You can now opt to either run make to create the necessary directory structure or conduct a manual install.
Makefile install
Please edit the Makefile found in the tarball. Adjust the `DESTDIR` to where you copied the files e.g. `/var/www/ganglia2` and `APACHE_USER` is the name of the user that runs the Apache server e.g. `apache` or `www-data` (Ubuntu/Debian). When done type
You should now be able to access Ganglia in your browser by going to e.g. http://server/ganglia2/
Troubleshooting
you need to copy `/var/www/ganglia2/apache.conf` (Ubuntu/Debian) or `/var/www/html/ganglia2/apache.conf` (CentOS/RHEL) to `/etc/apache2/sites-enabled`.
In most cases, you need to modify the above apache.conf to make sure the alias /ganglia refers to `/var/www/ganglia2` (Ubuntu up to 13.10/Debian) or `/var/www/html/ganglia2` (CentOS/RHEL/Ubuntu 14.04+) .
In most cases, you need to modify `/var/www/ganglia2/conf.php` (Ubuntu/Debian) to make sure `gweb_confdir` refers to the directory where the directories of `conf` and `dwoo` locate in, such as `/var/lib/ganglia-web` or `/var/lib/ganglia`.
Make sure you have the dir of rrds under `gmetad_root` e.g. /var/lib/ganglia/rrds
Make sure the above RRD files are owned by the same user as one running as gmetad e.g. nobody
Configuration
All of Ganglia configuration options can be found in `conf_default.php`. If you want to override them you will need to create a `conf.php` file. This way even if you upgrade Gweb 2.0 you will retain your customizations. For example I use the following override file
WARNING: If you end up changing `$conf['gmetad_root']` variable please check any other variables that depend on it like `$conf['conf_dir']` and `$conf['views_dir']`.
Timeline Zooming
You can zoom to arbitrary time on the graph by clicking on any of the graphs in cluster and host views. Click and hold the mouse when you do an outline will show up which will allow you to select time range you want. Once you release the mouse button the whole page will reload and show the new range.
Defining Custom Graphs Via JSON
Ganglia has supported the definition of custom graphs via PHP files for some time. Gweb2 continues to support PHP-based graphs, and adds support for JSON-based graphs as well. Defining graphs in JSON is much simpler (you don't need to know any `rrdtool` syntax) and will probably suit most cases. If you need more flexibility than in possible given the syntax supported by the JSON format, then defining a graph in PHP is still an option. In order migrate your PHP-based graphs to Gweb2, you will need to Migrating PHP Graphs to Gweb 2to your graphs as you copy them to the new install.
If a given report is defined in both PHP and JSON, the PHP file takes precedence.
JSON options
Key
Expected Value
report_name
Textual name of this report, used to identify the report to the engine. This should be the filename without the '.json' extension.
report_type
`standard` or `template`. Use `template` when you are using Graphite rendering, and want GWeb to replace `HOST_CLUSTER` in your Graphite config string with the actual name of the host the graph is for. This value is ignored when rendering with `rrdtool`.
graphite
Ampersand separated list of arguments to be passed to Graphite targets.
percent
Usually omitted. When specified with a value of '1', the graph is formed with all values being represented as a percentage of the aggregate total of all metrics.
title
Used to label the top of the graph.
vertical_label
Label for the y-axis.
scale
Scaling factor. All values are multiplied by this number before being graphed or displayed in the legend. (Normally omitted, which is equivalent to specifying "1")
series
An array of hashes, describing which metrics should be part of the graph.
show_total
If defined and set to '1', this adds an aggregate total for all of the displayed metrics to the graph legend.
`series` member hashes should contain the following values
Key
Expected Value
metric
The name of the metric to graph. Corresponds to an rrd file.
color
A hex value to color the line/area for this metric.
label
Label text for use in the graph's legend.
type
`line`, `stack`, `area` or `percentile`. Difference between stack and area are that if you specify something as a stack is that all stacked values will be stacked on top of each other whereas area types will not be stacked on top of each other. Percentile is a vertical line that displays percentile value for particular metric. Valid values are 0-100.
line_width
'1', '2', or '3'. Only relevant for `type`==`line` or `type`==`percentile`.
percentile
You need specify percentile value for the percentile line e.g. 75, 95 etc.
Show metric only in certain contexts
There are certain such as number of nodes (servers) in a cluster that will show only in meta and cluster contexts. You can define those metrics by adding a contexts array to the JSON definition for an item. You can also override the DS (datasource name) to be something other than the default "sum".
Views are arbitrary collection of metrics. They are useful if you want to have an easy overview of e.g. load on the webservers, DB servers, as well as number of SQL queries on host1.
There are two ways to create/modify views. One is via the Web GUI and the other one programatically by defining views using JSON.
Web GUI
Create views
To create views click on the Views tab then Click Create View. Type your name then click Create. Next step is to add metrics to a view.
Add metrics to a view
Above or below each metric or composite graph is a plus sign. Click on it. A window will pop up. Select the view you want the metric to be added. Repeat the process for consecutive metrics.
JSON definition for views
Views are stored as JSON files in the conf_dir. Default for the conf_dir is in /var/lib/ganglia/conf. You can change that by specifying an alternate directory in conf.php ie.
  php
  $conf['conf_dir'] = "/var/www/html/conf";
You can create or edit existing files. Name for a view needs to start with view_ and end with .json e.g. view_1.json or view_jira_servers.json. It needs to be unique. This is an example definition of a view which will result with a view with 3 different graphs.
View configuration file
Key
Expected Value
view_name
Name of the view
view_type
Standard or Regex. Regex view allows you to specify regex to match hosts
items
An array of hashes, describing which metrics should be part of the view.
`items` member hashes should contain the following values
Key
Expected Value
hostname
Hostname of the host for which we want metric/graph displayed
metric
Name of the metric e.g. load_one.
graph
Graph Name e.g. cpu_report, load_report. You can use only metric or graph keys but not both
aggregate_graph
If this value exists and is set to true item defines an aggregate graph. This item needs a hash of regular expressions and a description
If you add `aggregate_graph` item you need to specify a host_regex_hash that contains list of of regex elements. Please check the example for guidance on how to do it.
You can also embed composite graph/reports as described in the JSON definition above. The only difference is that you are required to add a unique key called item_id to identify the graph e.g.
Automatic rotation is a feature aimed for people in data centers that need to continuously rotate metrics to help spot early signs of trouble. It is intended to work in conjunction with views. To activate it click on Automatic Rotation then select the view you want rotated. Metrics will be rotated until the browser window is closed. You can change the view while the view is rotated and changes will be reflected within one full rotation.
Another powerful thing about automatic rotation is that if you have multiple monitors you can invoke different views to be rotated on different monitors.
Mobile
Mobile is a mobile optimized view for Ganglia. It is intended for any mobile browsers supported by jQueryMobile toolkit. This covers most WebKit implementations ie. Android, iPhone iOS, HP webOS and Blackberry OS 6+. Interface intends to provide a better experience viewing Ganglia on your mobile phone by eliminating panning and zooming.
Search
Search allows you to find hosts and metrics quickly. It has multiple purposes ie.
Find a particular metric - especially useful if a metric is rare e.g. outgoing_sms_queue
Quickly find a host regardless of a cluster
To use click on the Search Tab and start typing in the search field. Start typing a search term. Once you stop typing a list of results will appear. Results will contain
First a list of matching hosts
Second list of matching metrics. If the search term matches metric on multiple hosts all hosts will be shown.
Click on any of the links and a new window will open that will take you directly to the result. You can keep clicking on the results and for each result a new window will open.
To switch over to use Graphite for graph generation, you just need to add the following to `conf.php`:
  php
  $conf['graph_engine'] = "graphite";
You may or may not need to adjust the following configuration options in `conf.php` depending on your Graphite setup (these options should also be found in `conf_default.php`):
The directory structure of your RRD files will be symlinked to `$conf['graphite_rrd_dir']` with some minor changes (such as replacing space with "_"). The actual RRD files will not be duplicated.
WARNING: Certain reports (such as CPU Report) currently does not work correctly as the JSON representation does not support certain metric calculations
Other misc. features
Export metric data in JSON/CSV
You will notice little CSV and JS icons next to graphs displayed. Clicking on these will export graph values for the displayed time period in a CSV (comma separated values) or JSON format. If there are multiple metrics used to create graphs like in e.g. CPU report all metrics will be exported.
Metric groups initially collapsed
By default when you click on a host view all of the metric groups are expanded. You can change that so that only metric graph titles are showing and you have to click on the metric group to expand the view. To default to metric groups initially collapsed add following setting in conf.php
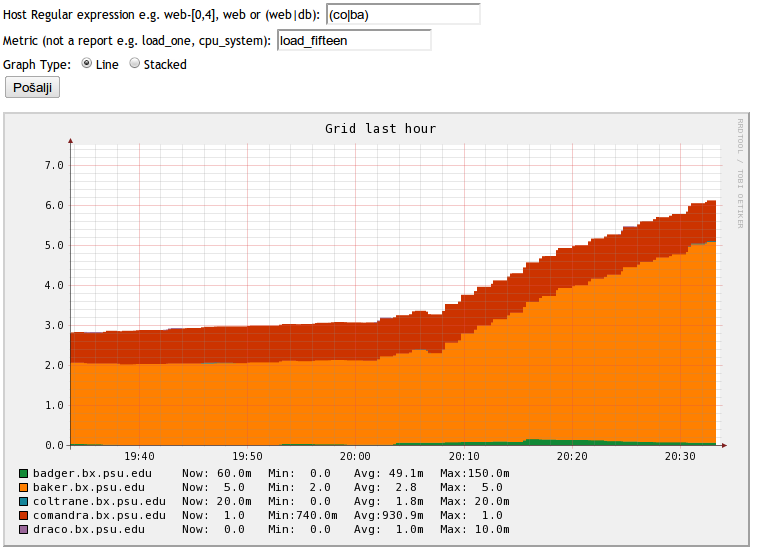
If you'd like to display only certain hosts in the cluster view you can filter them out using the text box that is located next to the Show Node drop down. Filter accepts regular expressions ie. you can show any host that has web in it's name by putting `web`
or to filter out webservers web10-web17 you could type `web1[0-7]`
or show me web03 and web04 and all mysql servers `(web-0[3,4]|mysql)`
Max graphs to show in cluster view
This feature has existed before but has been enhanced. This feature is intended to speed up cluster view rendering when you have lots of hosts in a cluster ie. hundreds or thousands. This will result in large load times as all images are rendered and downloaded. Instead you can opt to show only first X graphs. Rest of the graphs will not be loaded and will be replaced with a placeholder showing current metric value. You can do that on the fly by selecting from the drop down menu. You can also set a default by setting it in conf.php ie.
RRDtool graphs are composed of stair case curves by default. This is in line with the way RRDtool calculates its data. Some people favor a more 'organic' look for their graphs even though it is not all that true.
from https://github.com/ganglia/ganglia-web/wiki#Installation
--------
This is an attempt to make the Ganglia UI more usable.